PyGMT

dev

Getting Started

  • Overview
  • Installing
  • Intro to PyGMT

User Guide

  • Tutorials
  • Gallery
    • Maps and map elements
    • Lines and vectors
    • Symbols and markers
    • Images, contours, and fields
    • 3-D Plots
    • Seismology and geodesy
    • Base maps
    • Histograms
    • Plot embellishments
      • Colorbar
      • Day-night terminator and twilights
      • Directional map rose
      • GMT logo
      • Inset
      • Inset map showing a rectangular region
      • Legend
      • Magnetic rose
      • Multiple colormaps
      • PyGMT logo
      • Scale bar
      • Text formatting
      • Timestamp
  • Projections
  • External Resources

Reference Documentation

  • API Reference
  • Technical Reference
  • Changelog
  • Minimum Supported Versions
  • Ecosystem

Development

  • PyGMT Team
  • Contributors Guide
  • Maintainers Guide

Getting help and contributing

  • Code of Conduct
  • License
  • Contact
  • Source Code
PyGMT
  • Gallery
  • PyGMT logo
  • Improve this page

Note

Go to the end to download the full example code.
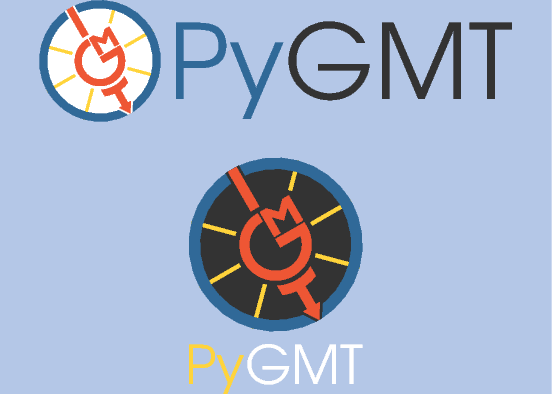
PyGMT logo

Beside the GMT logo, there is a separate PyGMT logo which can be plotted and added to a figure using pygmt.Figure.pygmtlogo. The design of the logo itself is kindly provided by @sfrooti and consists of a visual and the wordmark “PyGMT”.

The visual logo is available in circle and hexagon shapes. It supports both colored and monochrome black-and-white palettes, alongside light and dark theme modes, combining to yield 8 distinct standalone icon variants. Additionally, the visual logo can optionally include the wordmark “PyGMT”; if enabled, the wordmark can be positioned either to the right of the icon or beneath it.

import pygmt
from pygmt.params import Frame

Plot the PyGMT logo without any arguments:

fig = pygmt.Figure()
fig.pygmtlogo()
fig.show()
pygmtlogo

Via the color, theme, shape parameters the appereance of the logo can be changed:

fig = pygmt.Figure()
fig.basemap(region=[-1, 1] * 2, projection="X5c/5c", frame=Frame(fill="180/199/231"))

fig.pygmtlogo(color=False, position="TL")

fig.pygmtlogo(theme="dark", position="TR")

fig.pygmtlogo(color=False, theme="dark", position="BL")

fig.pygmtlogo(shape="hexagon", position="BR")

fig.show()
pygmtlogo

Via the wordamrk parameter the text “PyGMT” can be added on the right side or at the bottom of the visual:

fig = pygmt.Figure()
fig.basemap(region=[-1, 1] * 2, projection="X7c/5c", frame=Frame(fill="180/199/231"))

fig.pygmtlogo(wordmark="horizontal", position="TC", width="6c")

fig.pygmtlogo(theme="dark", wordmark="vertical", position="BC", height="3c")

fig.show()
pygmtlogo

Total running time of the script: (0 minutes 1.028 seconds)

Download Jupyter notebook: pygmtlogo.ipynb

Download Python source code: pygmtlogo.py

Download zipped: pygmtlogo.zip

Gallery generated by Sphinx-Gallery

Previous Next

© Copyright 2017-2026, The PyGMT Developers. Revision v999.1000.0.dev52+unknown.gf475c6856.d20260705. Last updated on Jul 05, 2026.

Built with Sphinx using a theme provided by Read the Docs

This website uses Google Analytics to gather usage statistics. However, it does not use cookies or track you across different websites. Page view data are used to help us improve the site and provide an estimate of the software usage.